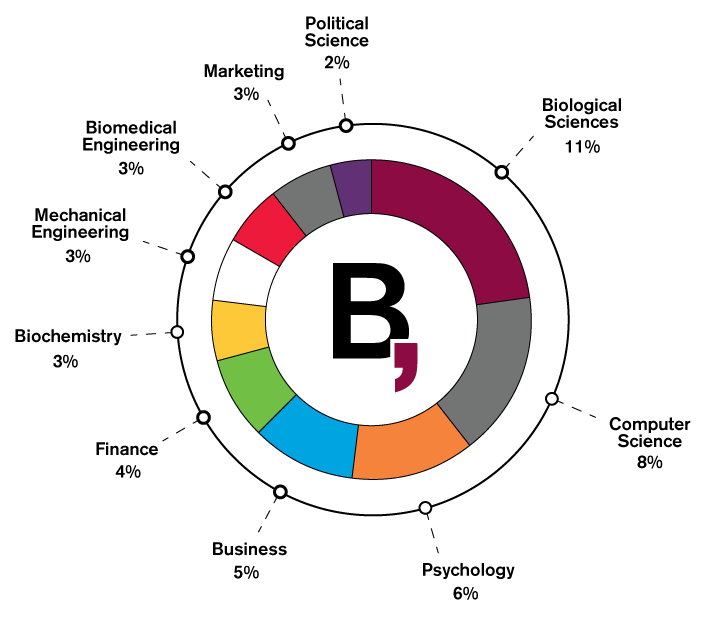
Barrett Facts and Figures
All information is current through the fall 2011 semester.
| Established |
|
1988 |
| Current Student Enrollment |
|
3,895 matriculated
(286 Downtown, 53 Polytechnic, 3421 Tempe, 135 West) |
| Current Alumni |
|
5,785 |
Student Profile
| Average Unweighted GPA of Entering First-Year Students |
|
3.84 |
| Average SAT Scores for Incoming Students (fall 2011) |
|
1315 |
| Average ACT Scores for Incoming Students (fall 2011) |
|
29 |
| Percentage of Female Students |
|
54% |
| Percentage of Male Students |
|
46% |
| Percentage of Entering Freshman in Top 10% of High School Class |
|
77% |
Academic Profile
| Student to Faculty Ratio in Classes Taught by Honors College Faculty |
|
15 to 1 |
| Number of Incoming National Scholars for fall 2011 |
|
123 National Merit Finalists
55 National Hispanic Scholars
2 National Achievement Scholars |
| Number of National Merit Scholars |
|
468 |
| Number of National Hispanic Scholars |
|
239 |
Geographic Profile
Percentage of In-State/Out-of-State Students
|
|
78/22% |
Percentage of International Students
|
|
4% |
Top 5 States of Origin (Other than Arizona)
|
|
California, Texas, Colorado, Washington, and Oregon |
Top 5 Countries of Origin (Other than US)
|
|
China, Canada, India, Mexico, and the United Kingdom |
|
3800+
Students enrolled in Barrett across all ASU campuses
77%
Barrett freshman in the top 10% of their high school class
1315
Average SAT score for Barrett students
3.84
Average high school GPA for Barrett students
15 to 1
Average student to faculty ratio for honors classes
700+
National Merit, Hispanic, and Achievement Scholars
|
2011-2012 Barrett Graduates – What are they up to now?